I live in an apartment near the top of College Hill in Providence, and the best thing about it is the view from the third floor balcony. On a good day we can see all the way into Connecticut and Massachusetts, and we always get a beautiful sunset.

One day I noticed that for just a few minutes before the sun passed under the horizon, it would shine onto my living room wall and the wall's color would turn a brilliant red. This led me to wonder whether I could calculate how fast the Earth is rotating just by measuring the rate of change of the wall's color as the sun set. I thought for a while about how to accomplish this and settled on the following rough idea:
- Take a stationary video of the wall over the ~10 minutes just before sunset.
- Use image processing software to measure the color of the wall as a function of time.
- Calculate the light spectrum emitted by the sun using Plank's law for blackbody radiation.
- Calculate the altered solar spectrum as a function of the amount of atmosphere the sunlight passes through using the formulae for Rayleigh scattering.
- Associate the colors measured in step 2 with the scattered spectra from step 4, this will then give me the amount of atmosphere the sunlight is passing through (let's call this $w$) as a function of time.
- Use geometry (and a bit of simple statistical mechanics) to relate $w$ with the angle of the sun relative to the horizon.
- Since I now have a relation between $w$ and time, and a relation between the angle of the sun and $w$, I can put them together to get the angle of the sun as a function of time, yielding my final answer.
To carry out this whole calculation, I have to make a number of simplifying assumptions which will undoubtedly lead to some inaccuracy, so I'm not expecting to get exactly the right answer, I'll be quite happy to just get the right order of magnitude. So lets get started.
Taking and Analyzing the Video
I took the video of the wall just by leaning my iphone up against a book on my living room table and pointing it at the patch of wall that the sunlight was shining on. The recording lasted just over 10 minutes before the sun dipped below the horizon. You can see in the gif below that I had to move a lamp out of the way a few minutes into the recording. To analyze the video and extract the color data, I took screenshots approximately every 30 seconds and then processed them in imageJ.

It turns out that analyzing the color of an image is not so simple, and there are many different ways to go about it. What I would ideally want to do is relate each color to a color temperature, which can be related to a specific blackbody spectrum which has some peak wavelength. But in general there isn't a unique one-to-one correspondence between a color and a color temperature.
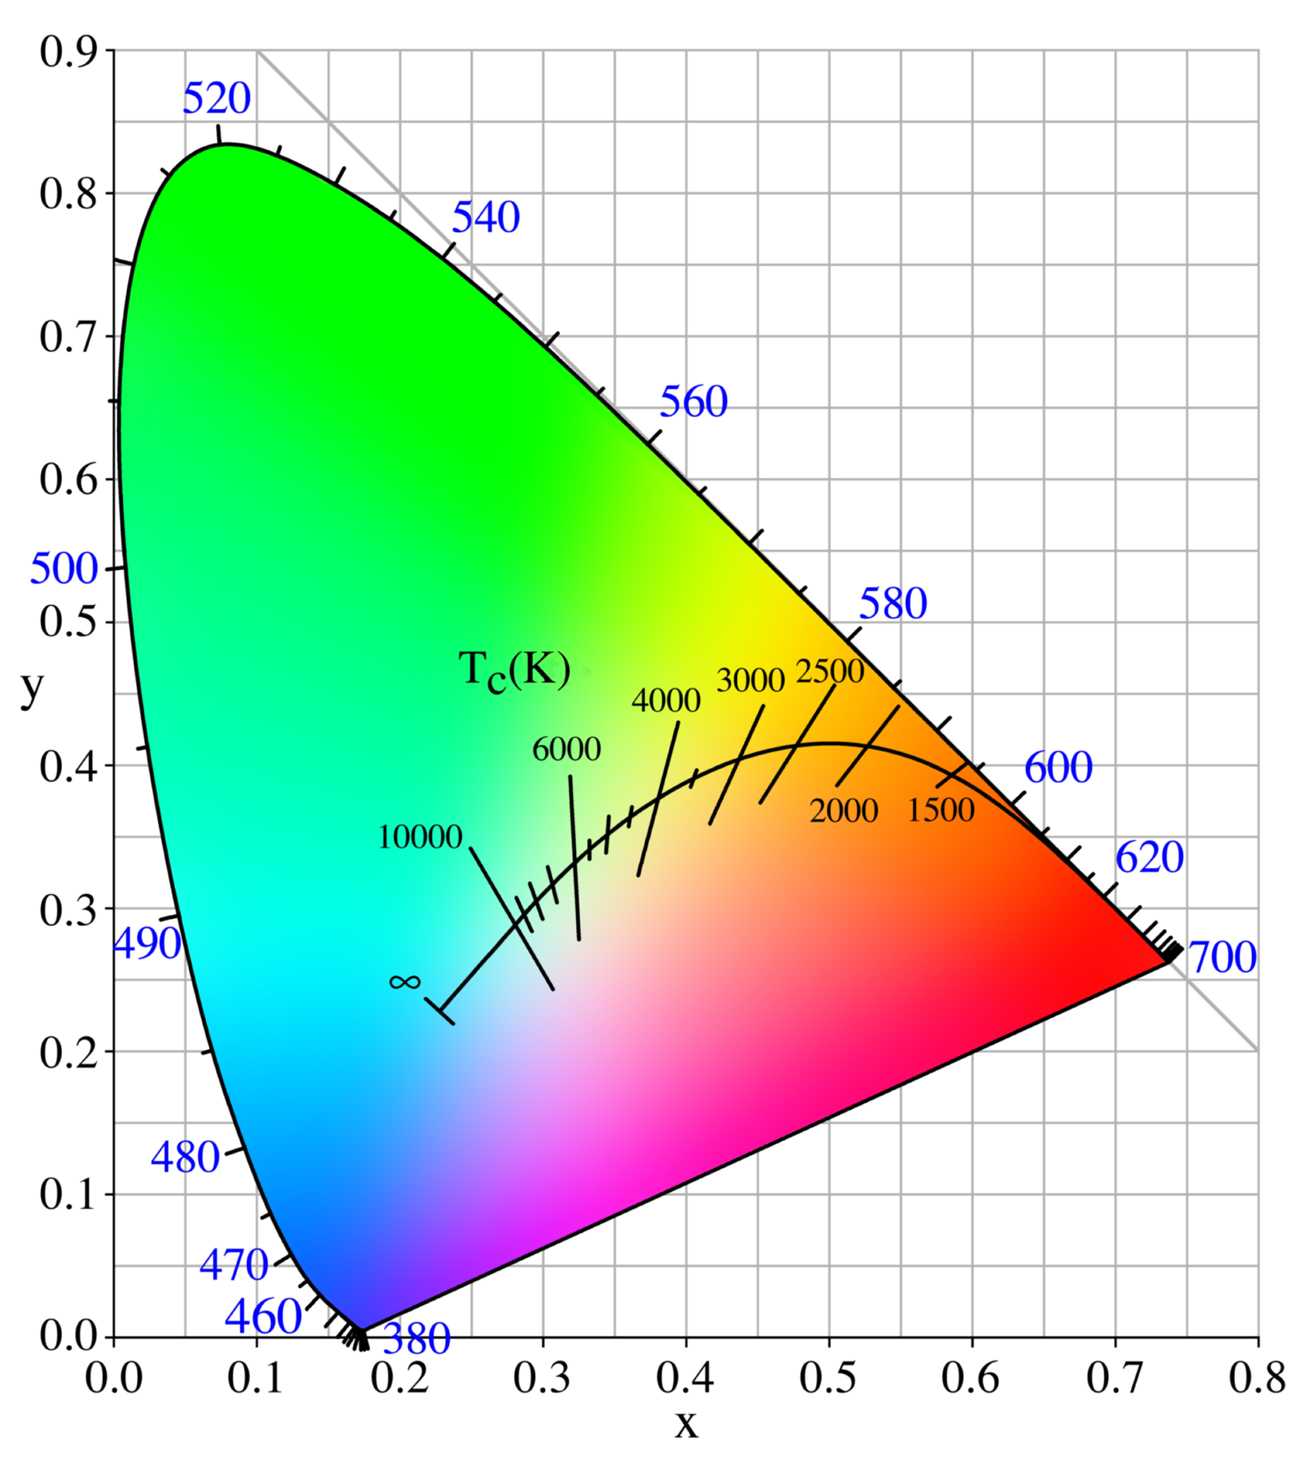
This one-to-one correspondence only exists for colors that lie along the Planckian locus, which is the curve appearing in the CIE 1931 chromaticity diagram on the right. So for simplicity's sake we'll just have to ignore some of these complexities and see if we can come up with a satisfactory way to relate a digital color with a monochromatic wavelength.
The first step to analyze the color of the screenshots was to convert them to HSV format, which stands for hue, saturation, and value. Then I measure the mean hue value within a selected region of the screenshot. I used ten different regions and then averaged the results of all of them to reduce the error that might be introduced from a particular selected region. From here, I could approximately map the hue to wavelength by following the advice of this useful stack-overflow post. The basic idea is that the hues ranging from ~0-270 can be related approximately linearly to the wavelengths of visible light within the region of about 450-650 nanometers. We choose these numbers because a hue of 0 is bright red which corresponds to a wavelength of ~650 nm, and a hue of 270 is a deep blue which corresponds to a wavelength of ~450 nm. Hues above 270 are in the magenta region which is not represented in the visible light spectrum so we ignore them. So now we can write a simple approximate formula to relate hue with wavelength:
$\lambda = 650 - \frac{(650-450)\times \text{hue}}{270}$
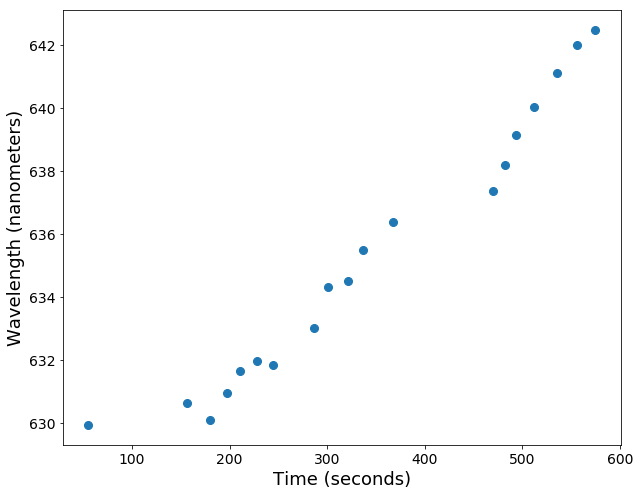
So I apply this formula to the hue data from each screenshot and then plot the monochromatic wavelengths that correspond to each screenshot. I was pretty happy when I first saw this plot as it shows an obvious trend toward redness (higher wavelength) as time goes on.
The Solar Spectrum and Rayleigh Scattering
So now I have some decent data representing the color of my wall as a function of time, but I still have to relate this somehow to the position of the sun in the sky. This is where some more serious physics comes in. First thing we need to do is figure out what the emitted light from the sun looks like. After that, we need to determine how the color of that light changes as it passes through the atmosphere.
To calculate the color of the light emitted by the sun, we'll employ the theory of black-body radiation. Whether you know it or not, you're already familiar with Black-body radiation, its the reason why objects start to glow red when they get really hot. We can approximate the radiation emitted by the sun by treating it as an ideal black-body, this allows to use Plank's law to calculate its emission spectrum knowing only its surface temperature (5778 K):

$B_{\lambda}(\lambda,T) = \frac{2\mathrm{h}c^2}{\lambda^5}\frac{1}{e^{\frac{\mathrm{h}c}{\lambda k_BT}}-1}$
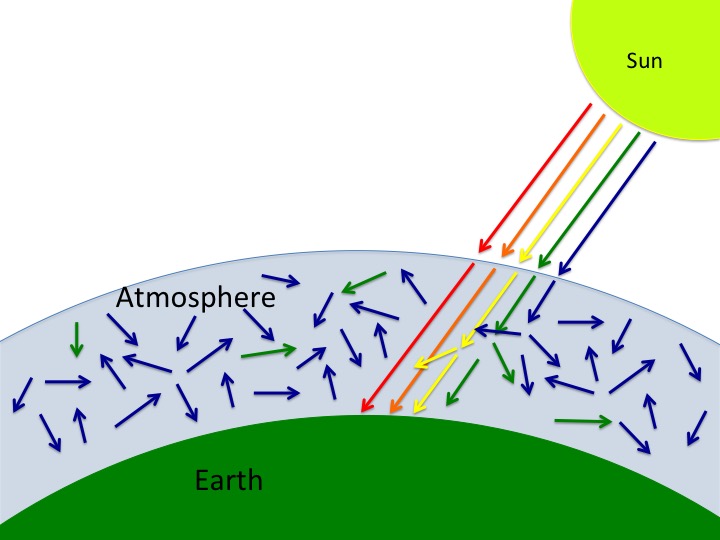
What this spectrum tells us is that the sun predominantly emits light with a wavelength of around 500 nm, which means the sun is actually green! So why do we think of the sun as being yellowish-orange? Well this has to do with Rayleigh scattering, which is also the reason why the sky appears to be blue. As the sunlight comes through the atmosphere, it bounces off all of the air particles, and according to the theory of Rayleigh scattering, the shorter wavelengths (blues and greens) get scattered more than the longer wavelengths (yellows and reds). So the effect of all this to us who live on the surface of the earth is that the sun appears to be much redder than it actually is, since a lot of the blue light has been scattered off into other parts of the sky, making the rest of the sky appear blue! This little graphic shows an exaggerated view of the effect that Rayleigh scattering has on sunlight:
So as the sunlight passes through different amounts of atmosphere, its perceived spectrum changes in a predictable way as different amounts of light get scattered away. I'll follow the argument laid out by J.D. Jackson in section 10.2 C of Classical Electrodynamics (3rd edition) to calculate the effect on the spectrum. The sunlight incident on the surface of the Earth will experience some attenuation that depends exponentially on the width of atmosphere it is passing through, $I(w) = I_0e^{-\alpha w}$, where $\alpha$ is an attenuation coefficient which depends on the density of gas molecules in the atmosphere and the total scattering cross section of air. Some math that I won't bore you with yields the following expression for $\alpha$:
$\alpha = \frac{32 \pi^3}{3N\lambda^4}|n-1|^2$
Where N is the number density of gas molecules in the air, and n is the index of refraction of air. We can see that this attenuation coefficient depends on $1/\lambda^4$, so the attenuation is much larger for shorter wavelengths (more blue). At this point, we need to make the simplifying assumption that the atmosphere has a uniform density, otherwise $N$ and $n$ would themselves be functions of $w$, adding two more layers of the complexity to the problem. I believe that this assumption is justifiable if we are careful about the geometry of the problem, which I'll discuss in the next section.
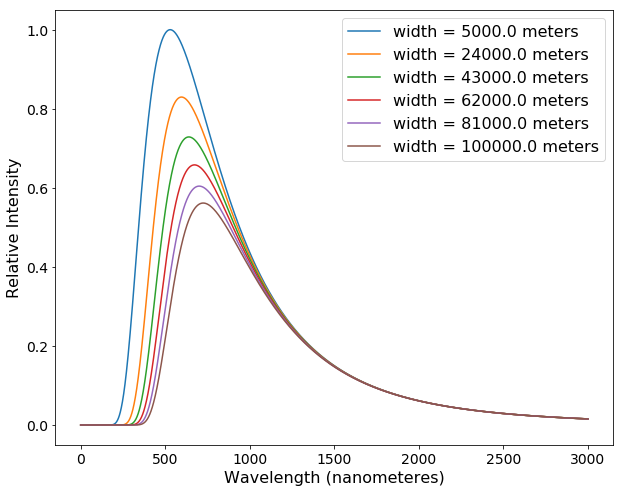
Now we can apply the above attenuation formula to the emitted solar spectrum that we calculated earlier and see how the transmitted spectrum depends on $w$. We see that the total amount of transmitted light decreases as $w$ increases, and the peak of the spectrum also shifts towards higher (redder) wavelengths. Now we want to relate these transmitted spectra with the wavelengths we calculated earlier from the video screenshots.
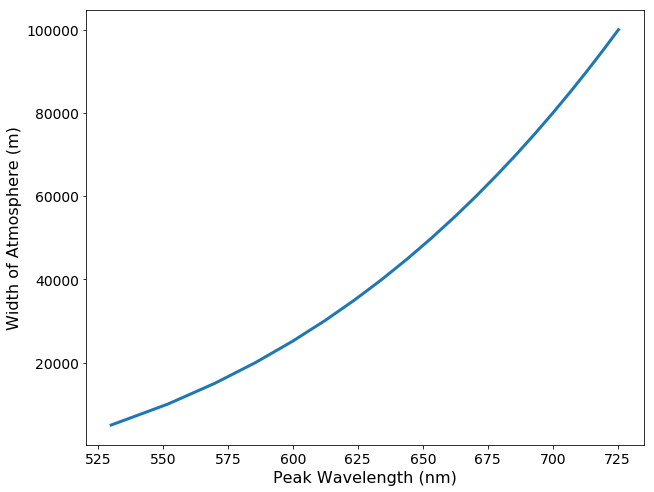
To do this, I'll plot $w$ as a function of the peak wavelength and do a simple polynomial fit. I find that the following formula fits the data adequately: $$w = 994\lambda^3 -2.48\lambda^2 + (2.19\times 10^3)\lambda - 1.5\times 10^5$$
Some Atmospheric Geometry
So just to recap, we've analyzed the video to obtain the peak wavelength as a function of time, and we have a function relating the peak wavelength to the width of atmosphere the sunlight has to travel through. Now the only piece of the puzzle missing is a relationship between $w$ and the angle of the sun relative to the horizon. Notice that $w$, the width of atmosphere the sunlight passes through, is different from $t$, which is the thickness of the atmosphere. We just need to do a bit of geometry and algebra to solve this part of the problem.
But first, we again need to make the simplifying assumption that the atmosphere has a uniform density (which it absolutely does not). Whats really important for this problem isn't the exact density profile of the atmosphere, its knowing approximately how many particles the sunlight passes by before it hits the surface of the Earth. So its fine to assume that the atmosphere has a uniform density, we just need to be careful about selecting that density as well as selecting the atmosphere's width. For simplicity lets just say that the pressure is 1 atm. To select the thickness we need to ensure that our simple model of the atmosphere contains the same number of particles as the actual atmosphere. Consider the simple sketch below:
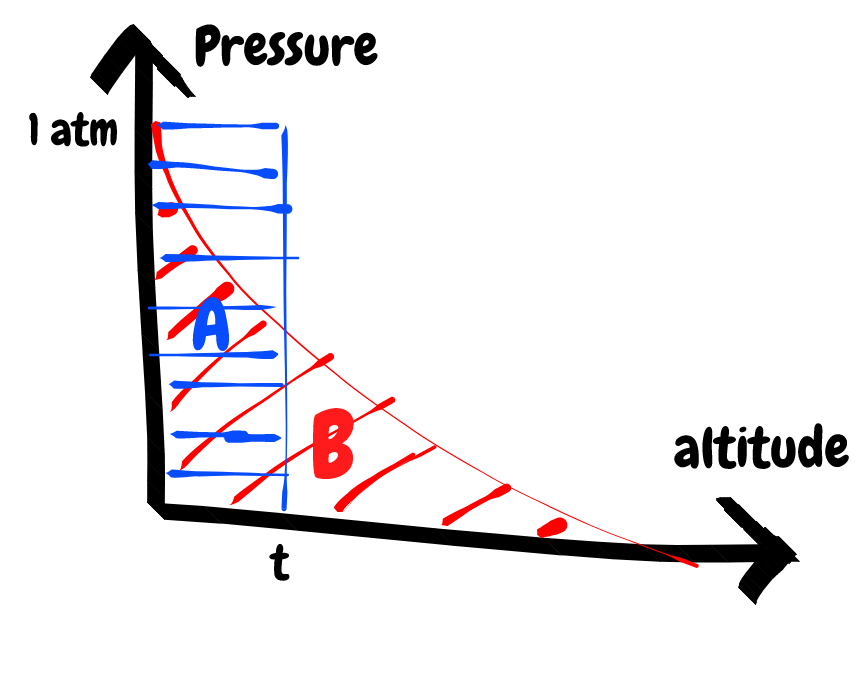
The actual pressure profile of the atmosphere follows the red curve, but we want to model it as the blue curve. So we just need to choose a thickness, $t$, such that the area A is equal to the area B.
We can accomplish this by a simple integration. We'll use a simple statistical model of the atmosphere, where the probability of finding an air particle at some altitude is proportional to the Boltzmann factor, $e^{E/k_BT}$, where $E$ is the energy of the particle, $k_B$ is the Boltzmann constant, and $T$ is the temperature. We will assume that the energy of the particle is just its gravitational potential energy, so $E = -mg\textrm{h}$. Now we can write down the pressure as a function of altitude, where $P_0$ is the pressure at sea level (1 atm):
$P = P_0 e^{-mg\textrm{h}/k_BT}$
Now we just need to integrate this from 0 (sea level) to infinity, set that integral equal to our uniform density model, and solve for $t$:
$\int_0^{\infty}{P_0e^{-mg\textrm{h}/k_BT}} d\textrm{h} = P_0t$
$\frac{P_0k_BT}{mg} = P_0t$
$t = \frac{k_BT}{mg}$
Plugging in 1 atm for $P_0$, the average mass of an air particle (28.96 g/mol), and 298 K for the temperature, we obtain a value for the thickness of the atmosphere in our uniform density model of 8,719 meters.
Using this value we can now go ahead and solve for the relationship between the width of atmosphere that the sunlight passes through and the angle of the sun in the sky. We'll start by drawing out a diagram of the situation and labelling all the relevant parameters.
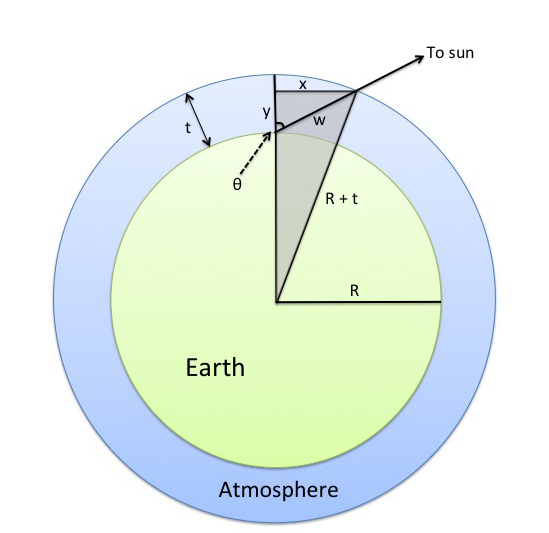
What we are trying to find is the function $\theta(w)$. We can do that with some simple trigonometry using the right triangle which is bounded by $R+t$, $x$, and $R+y$, and has been shaded in grey.
First we write out the pythagorean theorem for the grey triangle, and define $x$ & $y$ in terms of $w$ & $\theta$:
$(R+y)^2 + x^2 = (R+t)^2$
$x = w\sin(\theta) \quad y = w\cos(\theta)$
Now we just plug in $x$ & $y$ and solve for $\theta$:
$(R+w\cos\theta)^2 + w^2\sin^2\theta = (R+t)^2$
$R^2 + 2Rw\cos\theta + w^2\cos^2\theta + w^2\sin^2\theta - R^2 -2Rt -t^2 = 0$
$w^2 + 2Rw\cos\theta - 2Rt - t^2 =0$
$\cos\theta = \frac{t^2 + 2Rt -w^2}{2Rw}$
$\theta(w) = \cos^{-1}\left[ \frac{t^2 + 2Rt -w^2}{2Rw}\right]$
And there we have it, using the assumption that the atmosphere has a uniform density and has a thickness $t$, we can now relate the angle of the sun in the sky with the width of atmosphere it has to pass through. Thanks to my colleague David Osterman for some help with this section.
Putting It All Together
So now we just need to stitch these three parts together to finally calculate the rotational velocity of the Earth. We'll first take the wavelength vs. time data from the first section and use the relationship between the peak wavelength and $w$ as well as the relationship between $w$ and $\theta$ to convert the wavelengths to angles. After cranking the data through these functions, I then just fit a simple linear model to the data, $\theta = \omega t + \theta_0$, where $\omega$ is the angular velocity of the Earth and $t$ is time (not thickness). This is the result:
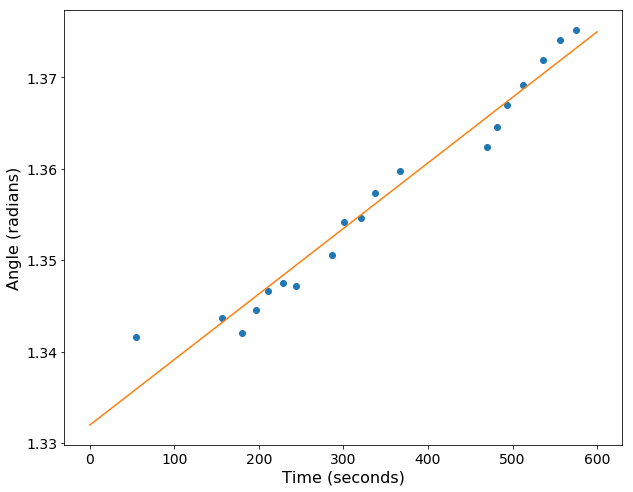
The best fit parameters are $\omega = 7.17 \times 10^{-5}$ radians per second and $\theta_0 = 1.332$ radians. The exact angular velocity of the Earth isn't a number we think about very often so its not immediately obvious if this is the right answer or not, but we can easily use this figure to find the period of the Earth's rotation (24 hours). Doing this I find that the predicted period of rotation of the Earth is 24.34 hours!
So to sum up, we started with just a stationary video of my living room wall, and using just that video and some knowledge of physics and geometry, we were able to predict the length of day to within just 20 minutes! Im quite proud of this result, and was shocked that the prediction was so close. Although I have to admit that some of this is surely due to luck as well as some somewhat arbitrary decisions made for certain parameters such as the temperature or the wavelength best associated with red/blue. But either way, this was a fun exercise in physics and Im happy to even come within an order of magnitude of the correct answer.
If you've made it this far, thanks for reading! Feel free to leave some feedback and comments below.
To stay up to date on future posts, follow me on twitter!
Addendum:
The clever among you might realize that there were some important considerations that I left out, most notably my position on the Earth relative to the equator, which would surely affect the result since the sun doesn't set totally vertically but has some horizontal velocity through the sky. I thought for a bit about how to best include this consideration and even consulted some astronomer friends, but it seemed to overcomplicate the problem beyond the scope of this blog and I chose to move on with my life instead. Would love to see someone else take a crack at it though!